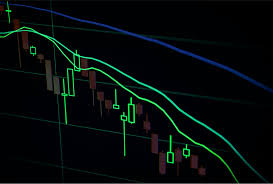
Gann belongs to the technical analysis category and is a very favorable indicator that performs the same function of support and resistance. One of the most important variables of this indicator is geometry, because according to the follower, W.D. Gann, the markets are geometric. Based on his proposal, he developed geometric structures and mathematical tools that are key to revealing course movements in both the context of the action and the index.
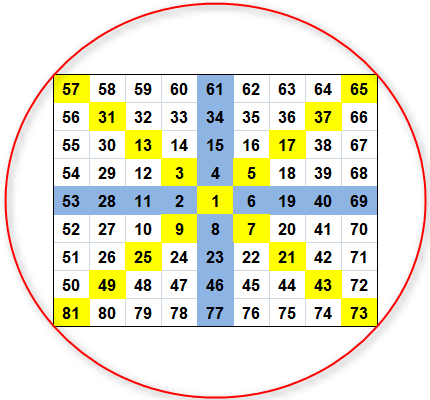
Gann's theory focuses on the ideology that geometry is relative to time and price. This is somewhat simplistic thanks to a chart called Ganna square or Gann Master Chart, which became the basis of Ganna trading. It consists of numbers, one of which is the midpoint and gradually continues counting to 81 in the form of a spiral. Ganna Square is designed to accurately assess time and price, and its main purpose is to determine the time compensation for swing trading and price alignment to accurately predict price changes. It is also a flexible tool that helps investors determine the level of support and resistance of shares.

Application of Ganna Square
Keep in mind that there are specific sets of numbers that are of lasting importance when it comes to price forecasting. These sets are presented in the form of a cross. Ganna square can also be seen as a circle, which means that the table can be divided into 8 equal parts, each of which corresponds to 45 degrees. Combining them all, they form a total of 360 degrees or a full circle.

Applying this principle, you can see that there are eight sets on the card that appear to be the ordinal and cardinal cross. Each arm of both crosses means 45 degrees with 360. The cardinal cross (blue) defines the most realistic support and resistance, while the plain cross (yellow) reveals strong supports prone to breakouts.
- 0/360 degrees= (2, 11 ,28, 53)
- 45 degrees= (3, 13, 31, 57)
- 90 degrees= (4, 15, 34.61)
- 135 degrees= (5, 17, 37, 65)
- 180 degrees= (6, 19, 40, 69)
- 225 degrees= (7, 21, 43.73)
- 270 degrees= ( 8, 23, 46, 77)
- 315 degrees= (9, 25, 49, 81)
Current Gann guidelines
- If the system revealed a high price on Friday, expect higher highs next week. The same rule can be applied when the low price appears on Friday.
- During a strong upward trend, weekly lows often appear on Tuesday, while during a strong downward trend, weekly highs usually appear on Wednesday.
- When a double or triple bottom appears on the monthly chart after a six-month period, it can be concluded that this is a new downward trend.
- Double and triple peaks must appear on the chart after six months to confirm a new downward trend.
Request
The Ganna indicator is an ideal approach to revealing different forms and patterns. While there is a question of whether such an approach is feasible and many are skeptical about its application, it still matters for other fields, including architecture and design.